 Ryan Yang

A dashboard, about ten conversations, and a few weeks of alignment turned a stalled funnel into the first sales we’d never had.
I built a dashboard to answer a simple question: where do our new users get stuck?
It answered almost instantly. A large share of people who had signed up and verified their account stopped at the same step: creating their first listing. I was the first to see it, and I put it in front of our product team the moment the first version went live.
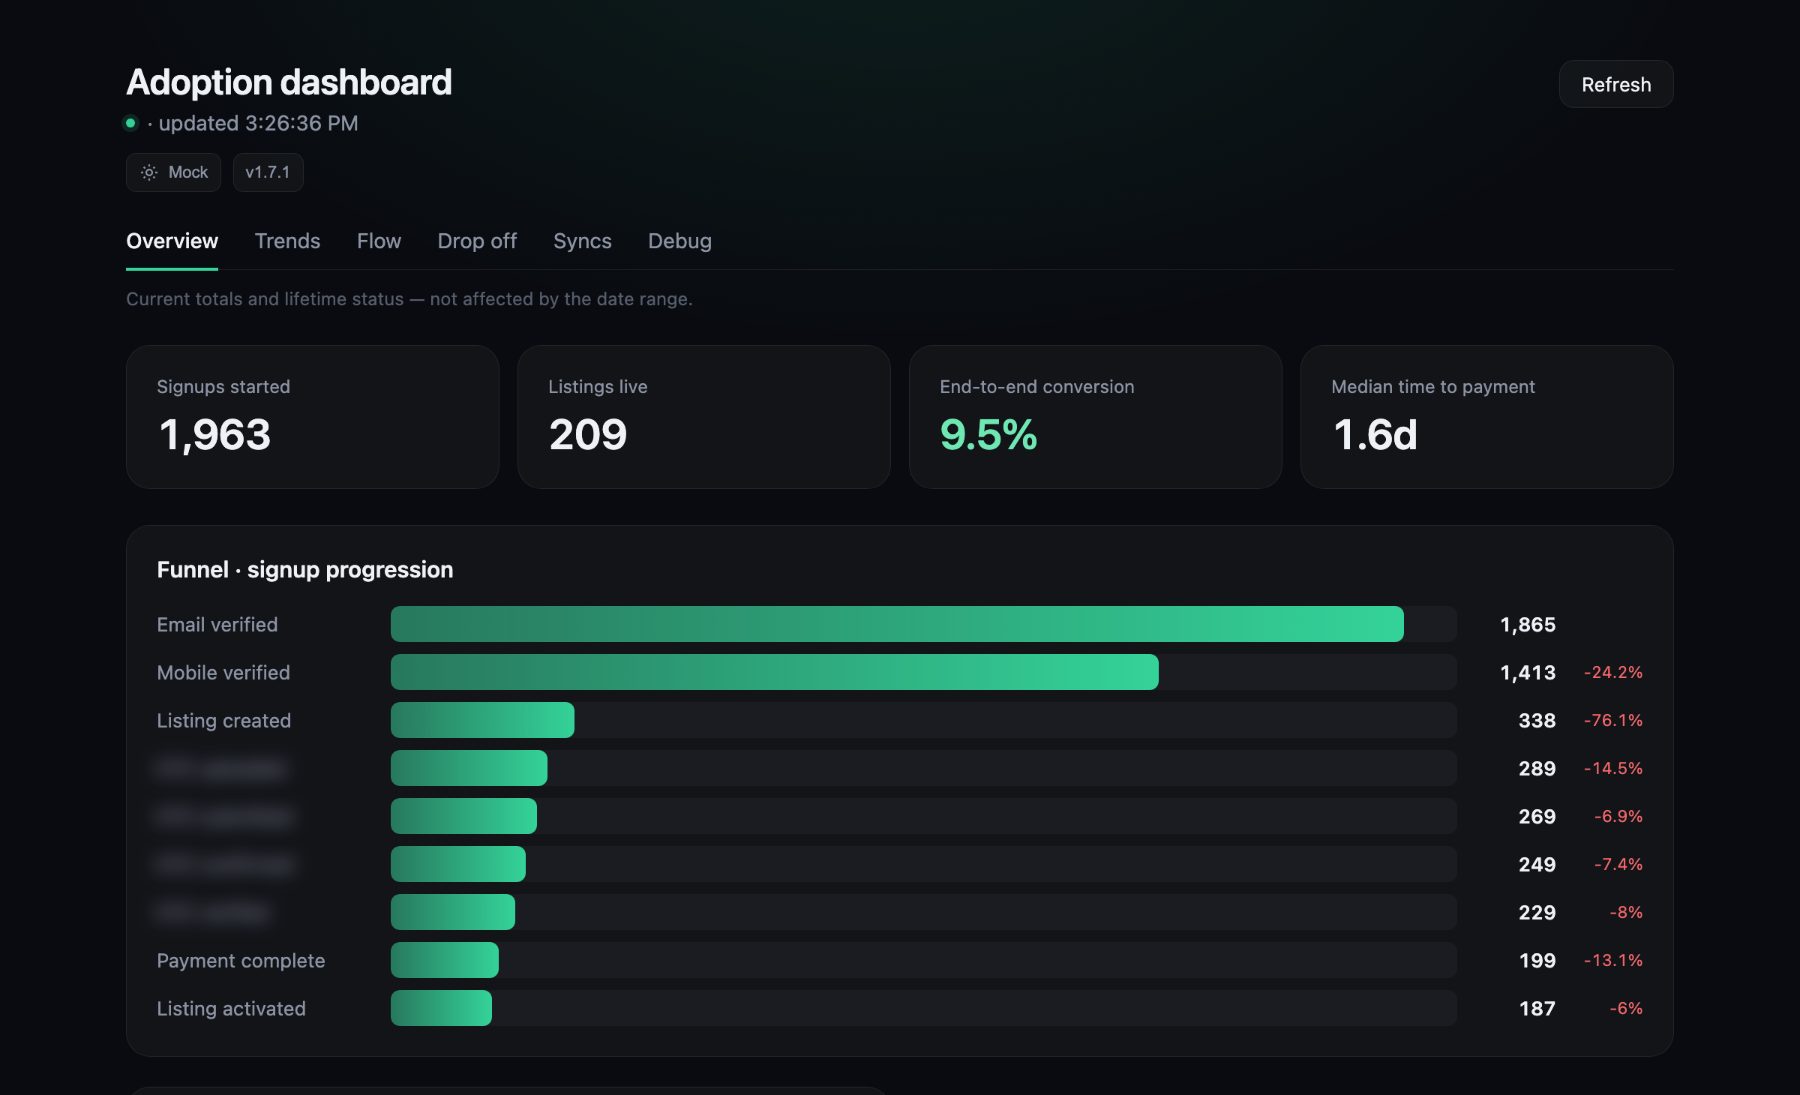 Illustrative sample data.
The chart told me where. It had nothing to say about why.
Everyone has a theory
When a funnel has a cliff in it, theories arrive fast. The form is too long. The button is in the wrong place. The copy is confusing. Each one is plausible, and each one is cheap to act on.
None of them were the answer. So we did the slower, more useful thing: we asked.
From a percentage to people
A drop-off rate is an abstraction, and you can’t call an abstraction. So alongside the funnel we added a list of the users who had started but never finished, with their personal details masked until someone had a reason to look.
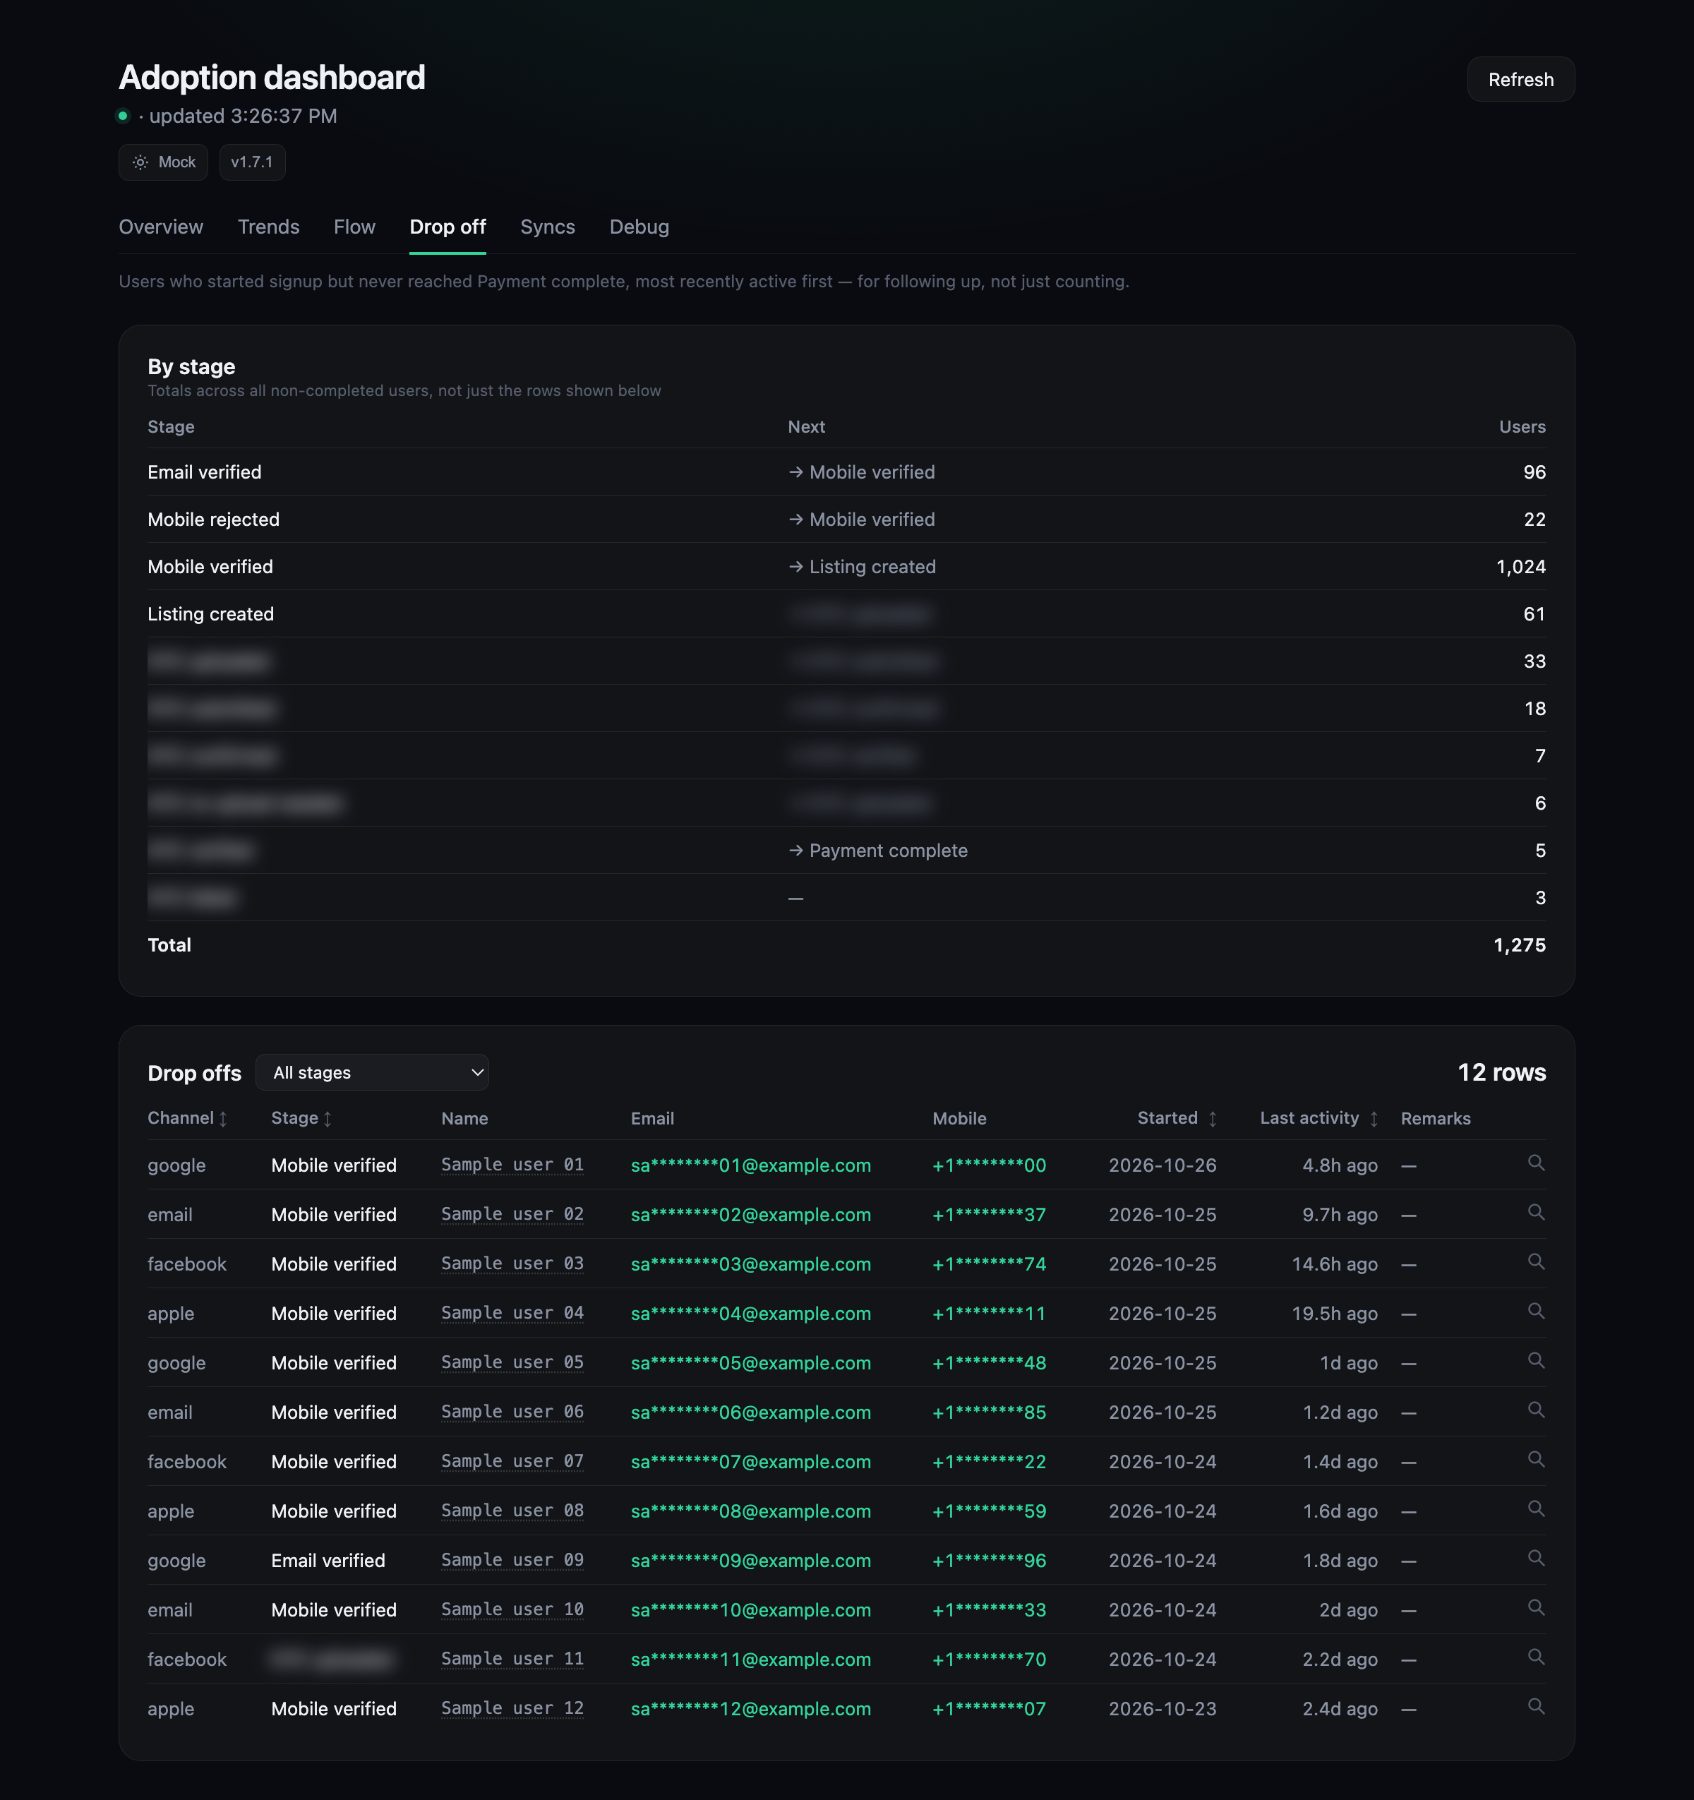 Illustrative sample data. All names and contact details are made up.
That one change moved us from “most people stall here” to “these are the people to talk to.” The team used the list to reach out, and we spoke to about ten of them. We also read what users were telling us through the feedback form inside the app.
“I can find my property in the list, but when I try to finish, it says the listing isn’t available.”
Paraphrased from user feedback.
The answer was consistent, and it wasn’t about the screen at all. In our mainstay locations, users couldn’t create the listings they wanted, because those products sat under a paid subscription model. It wasn’t a bug. It was a product boundary.
The part that wasn’t engineering
Knowing the cause didn’t mean we could fix it. Opening those products meant setting new prices in the very locations our subscription revenue depends on. That is a decision for commercial and pricing, not for engineering, and it took a few weeks of alignment.
A price isn’t only a number. It’s a promise to the customers who already pay it. Moving too fast there would have been the wrong kind of speed.
On the engineering side, this was the easy part. I led the design of the system, and in it products and locations are configuration, not code. So enabling the new ones was a small change. Once pricing and commercial committed to the prices, we had it live within three days, by that Friday.
What happened next
By Sunday, the first purchases ever arrived in the two highest-priced categories in those locations, categories that had never sold before. The average purchase was roughly four times what it had been.
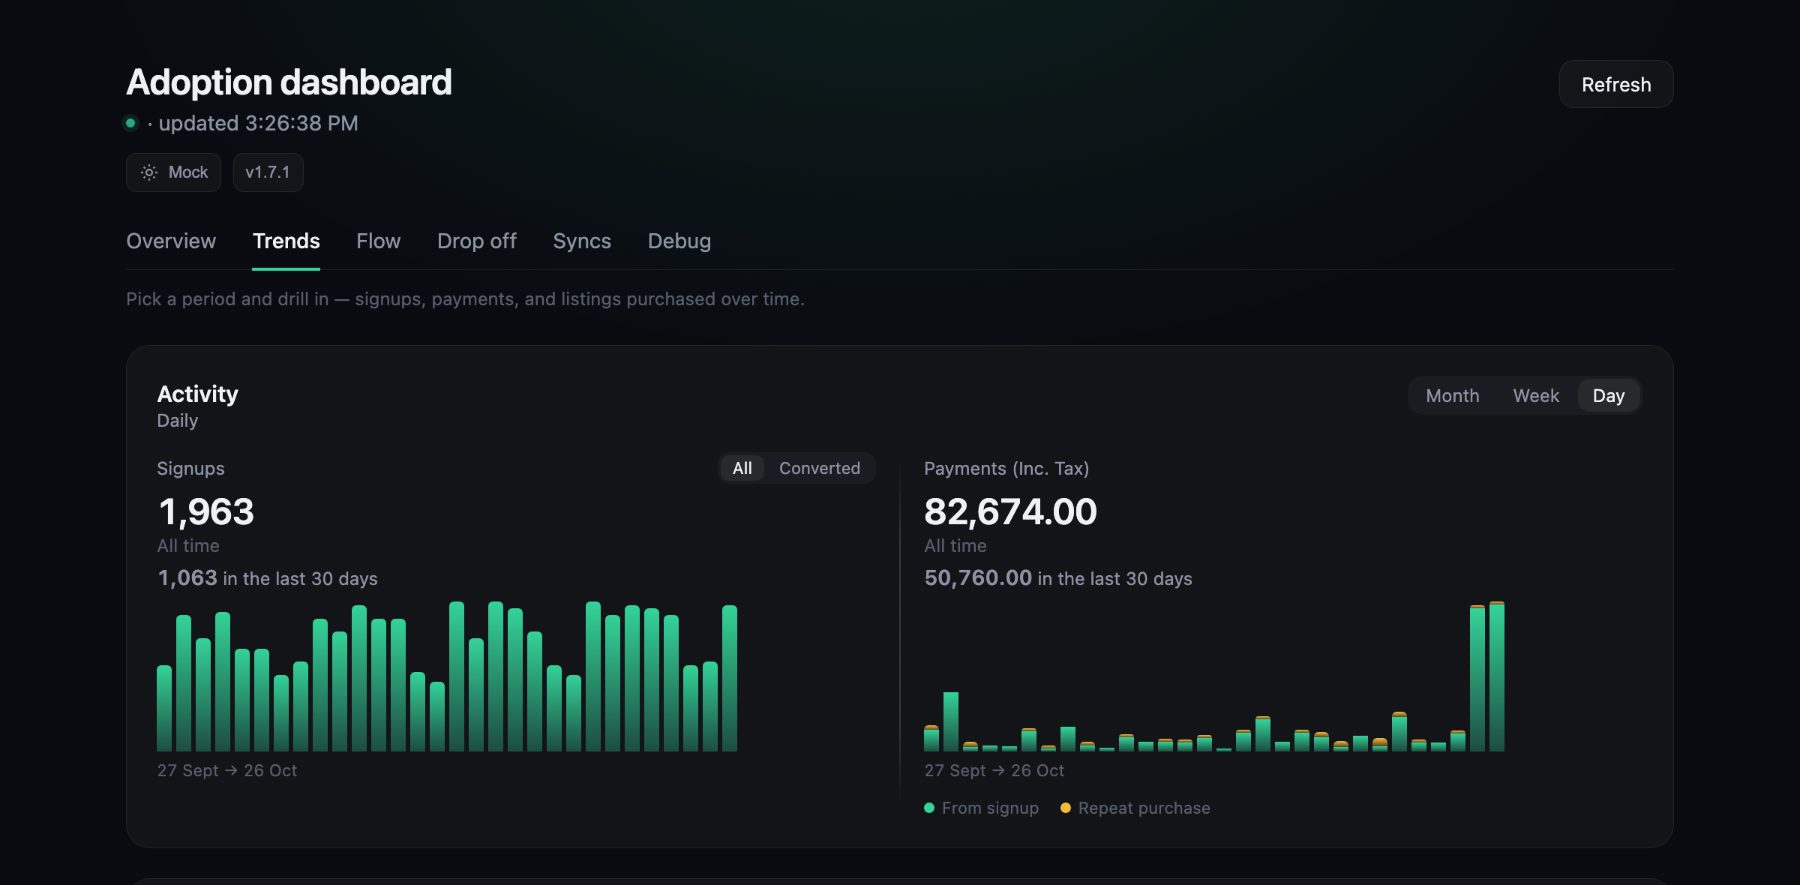 Illustrative sample data: payments jump in the last two days.
The sample is small, a handful of purchases, so I’m calling it a signal, not a result. But it came from exactly where the conversations said it would.
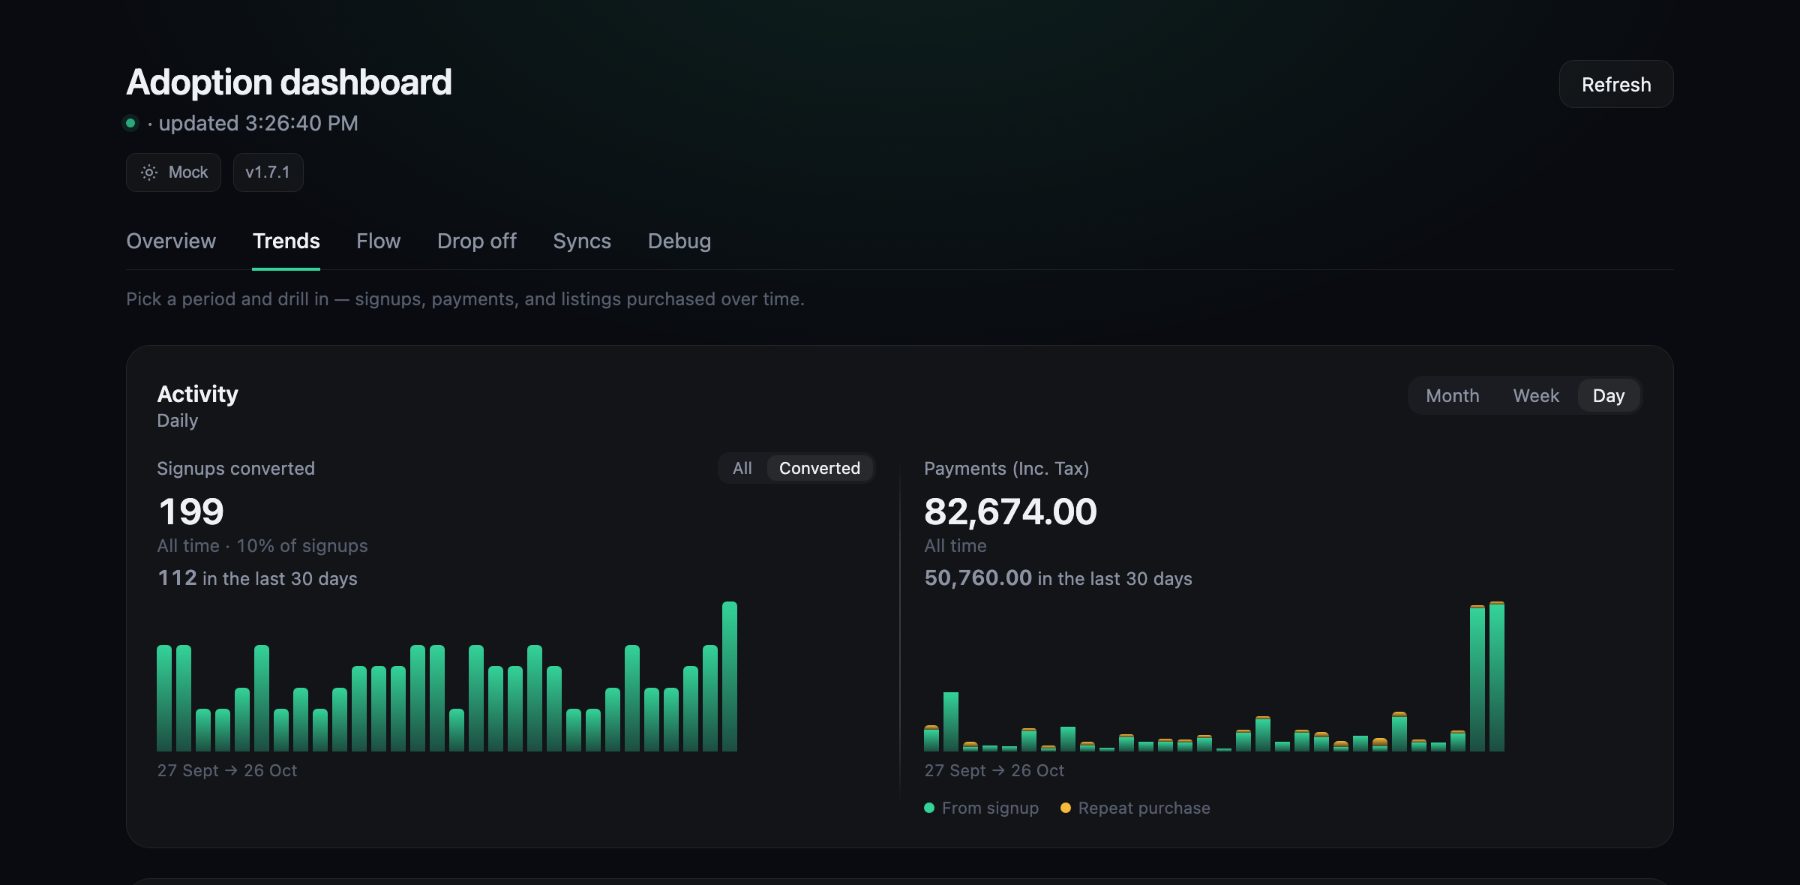 Illustrative sample data: the same chart, filtered to signups that paid.
What I took from it
- A dashboard’s job isn’t to impress. It’s to get the right people talking sooner. The value wasn’t the chart. It was the follow-up list that put us in front of real users.
- The fastest fix isn’t always code. Sometimes the work is making sure the right people understand the trade-off, and then being ready to ship the moment they decide. Being ready was a design choice: products and locations are configuration in our system, not code.
- Engineering teams can make a difference to product adoption, not just ship features. The dashboard found the problem, the follow-up list put us in front of the users behind it, and a system built on configuration meant the fix landed in days.
The funnel tells you where. Customers tell you why.
A related read: The Invisible Seams: Why Your Autonomous Teams Are Breaking Your Product.